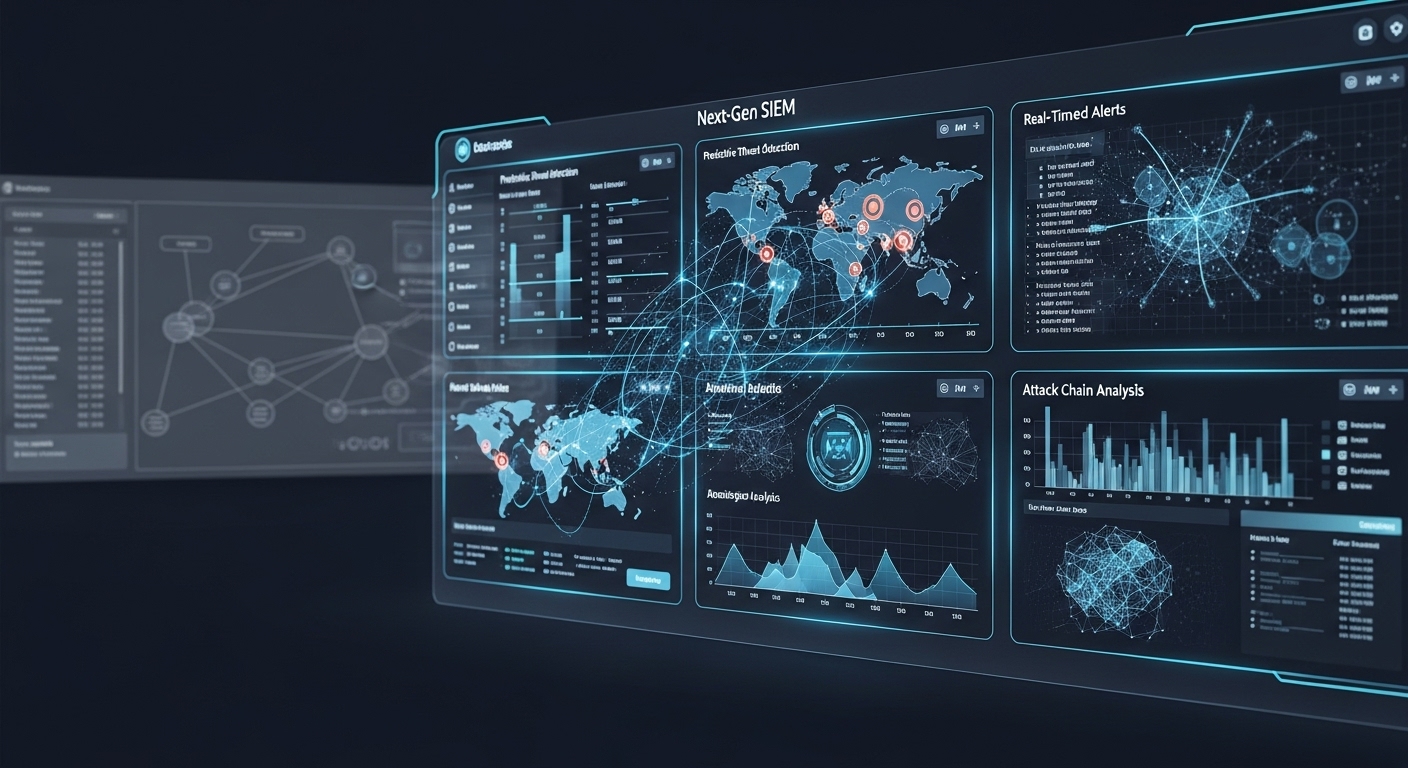
SIEM performance tuning is the process of optimizing query execution, log ingestion pipelines, dashboard rendering, and search-time data structures to ensure your security operations platform returns results in seconds—not minutes. Without deliberate tuning, even a well-architected SIEM will degrade under the weight of enterprise-scale telemetry, leading to analyst burnout, missed detections, and compliance gaps. For teams running ThreatHawk SIEM, a modern next-generation security information and event management platform, performance tuning is not an afterthought—it is a continuous operational discipline that directly impacts mean-time-to-detect, mean-time-to-respond, and overall SOC efficiency.
This guide covers the critical dimensions of SIEM performance tuning: query optimization, index and data model design, dashboard performance, pipeline and parser efficiency, and the operational cadence required to maintain peak performance over time. Whether you are tuning a legacy platform or deploying a fresh instance of ThreatHawk SIEM, the principles here apply across the enterprise security monitoring lifecycle.
Why SIEM Performance Degrades Over Time
SIEM platforms experience unavoidable performance drift as data volume scales, detection logic matures, and dashboards accumulate query overhead. Understanding the root causes of degradation is the first step toward effective tuning.
Log volume growth is the most obvious factor. A SIEM that ingests 10 GB per day on day one may ingest 500 GB per day within eighteen months as additional sources come online—cloud workloads, endpoint telemetry, identity logs, and IoT sensors all contribute. Without corresponding tuning, query response times increase linearly or worse. Index fragmentation, unbounded field extraction, and poorly scoped time ranges compound the problem.
Dashboard proliferation represents a silent performance killer. SOC teams create dashboards for every use case: threat hunting, compliance reporting, executive summaries, incident triage. Each dashboard may run dozens of scheduled queries. When many dashboards refresh simultaneously—say at the top of every hour—the query scheduler becomes a bottleneck, delaying critical alerts and degrading analyst experience.
Data model bloat occurs when teams extract every possible field from raw logs without considering query access patterns. A firewall log that generates 200 extracted fields when only 15 are used for detection logic creates unnecessary indexing overhead. Similarly, storing full packet captures or verbose audit trails in the hot storage tier consumes expensive resources without proportional detection value.
Enterprise Performance Reality Check: A typical Tier 1 SOC analyst runs 40–60 searches per shift. If each search takes 30 seconds instead of 5, the cumulative impact is 30–50 minutes of lost productivity per analyst every day. At scale, that equals a full FTE's worth of wasted time per quarter.
Query Optimization Fundamentals
Optimizing searches is the highest-leverage performance tuning activity because every attempt to query the platform—from scheduled correlations to ad-hoc investigations—benefits from better query design. The goal is to return the smallest possible result set with the fewest processing steps while maintaining detection accuracy.
Time Range Scoping
The single most impactful variable in SIEM query performance is the time range. An unbounded search that defaults to "All Time" scans every indexed event in the data store. Narrowing the time range to the smallest window that answers the investigative question—for example, "Last 4 Hours" instead of "Last 7 Days"—can reduce query execution time by 80% or more. Train analysts to always specify a time range before running a search, and configure default search timeouts at the platform level to prevent runaway queries.
Field Filtering Before Transformation
Apply filter conditions before eval, stats, or transaction commands in your search processing language. Filtering early reduces the number of events that flow into computationally expensive transformation stages. A search that filters on source_type=windows_security AND event_code=4625 before evaluating account names or geographic location data will execute significantly faster than one that extracts all fields first and filters later.
Avoiding Runaway Wildcard Searches
Leading wildcard searches—queries that start with an asterisk, such as *admin*—force the search engine to scan every token in every indexed event, bypassing index-based lookups entirely. Use trailing wildcards where possible (admin*), and consider reverse indexes or tokenization strategies for common search patterns that require substring matching. In ThreatHawk SIEM, the platform's next-generation indexing engine handles certain wildcard patterns more efficiently than legacy SIEMs, but best practice still favors structured field filtering over wildcard expansion.
Aggregation Best Practices
When computing statistics over event sets, choose the right aggregation granularity. For compliance dashboards that report daily event counts over a 30-day period, use time-bucketed aggregation (e.g., | timechart span=1d count) rather than scanning raw events and grouping by date at render time. Similarly, pre-compute and store summary data for frequently accessed metrics using data model acceleration or scheduled summary indexing features. This approach trades a small amount of storage for dramatically faster dashboard load times.
Index Strategy and Data Model Tuning
How your SIEM organizes data at the index level determines the ceiling of possible query performance. A well-planned index strategy aligns with access patterns, retention policies, and compliance requirements while minimizing the number of indexes that any single query must traverse.
Index Consolidation Versus Segmentation
The tension in index design is between consolidation (fewer indexes, simpler search syntax) and segmentation (more indexes, faster targeted queries). The optimal approach is a tiered strategy: use one or two primary security data indexes for the majority of detection and investigation queries, then segment only for data with fundamentally different access patterns or retention requirements. For example, place all firewall, endpoint, and identity logs into a main security index with 90-day hot retention. Place high-volume, low-signal data such as DNS resolver logs into a separate index with shorter retention and slower storage tiers.
Field Extraction and Indexed Fields
Every extracted field consumes index resources. Audit your current field extraction configuration—both inline extractions and search-time field extraction rules—and remove any that are not actively used in correlation rules, dashboards, or reports. For fields that are critical to detection logic, configure them as indexed fields (or strong typed fields in next-generation platforms) to enable faster lookups. Non-critical fields can remain as search-time extractions, which are processed on demand rather than at index time.
In ThreatHawk SIEM, the platform provides a field usage analyzer that reports how often each extracted field is accessed by queries and dashboards, making it straightforward to identify and retire unused fields. This capability alone can reduce index storage requirements by 20–35% in mature deployments.
Data Model Acceleration and Summary Indexing
For compliance and executive dashboards that query the same metrics repeatedly—logins per hour, failed authentication rates, firewall deny counts—use data model acceleration or summary indexing to pre-compute results at scheduled intervals. Accelerated data models trade a one-time processing cost at index time for near-instant query responses when the dashboard renders. Configure acceleration for the top 5–10 most frequently accessed data models and review their coverage quarterly as detection priorities shift.
Dashboard Optimization Strategies
Dashboards are the face of the SIEM to most stakeholders, but they are also the primary source of scheduled query load. Optimizing dashboards requires discipline at design time and ongoing governance at runtime.
Minimize Concurrent Refresh Intervals
Stagger dashboard refresh schedules to avoid thundering herd scenarios. Instead of setting all compliance dashboards to refresh at the top of every hour, distribute refresh times across the hour window. Use longer refresh intervals for non-critical dashboards—15 minutes for real-time monitoring views, 1 hour for daily operational dashboards, and 24 hours for executive summaries or compliance reports.
Design for Search, Then Filter
Every dashboard panel should be designed with the assumption that the data set has already been reduced as much as possible before the panel applies its own filters. Use base searches or shared data sources that scope the time range and apply broad filters at the dashboard level, then let individual panels refine further. Avoid dashboards where each panel runs an independent full-index search.
Limit Panel Complexity and Visualization Overhead
Dashboard panels that render complex visualizations—heat maps, treemaps, Sankey diagrams—perform slower than simple tables, bar charts, or single-value panels. Use the simplest visualization that communicates the metric effectively. For dashboards that are loaded frequently, consider static summary panels that display pre-computed values rather than real-time query results.
Use Time Range Pickers Wisely
If a dashboard is designed with a global time range picker, ensure that all panels inherit that single time range instead of each panel having its own time specification. This allows the query engine to optimize under a single time constraint rather than evaluating overlapping intervals. Panels that genuinely require different time windows—for example, a "Current Week" incident panel alongside a "Last 30 Days" trend panel—should be placed on separate dashboard pages or clearly separated in layout.
Transform Your SOC Performance with Optimized SIEM Operations
Discover how ThreatHawk SIEM's performance optimization tools—field usage analyzers, data model acceleration, and intelligent query scheduling—can reduce your average query response time by 60% while cutting index storage costs by up to 35%. Get a personalized demo and performance assessment.
Pipeline and Parser Performance
Log ingestion pipelines are the critical path for SIEM performance. If the pipeline cannot keep up with peak ingestion rates, data backs up, events are dropped or delayed, and detection rules fire late or not at all.
Parser Efficiency and Parsing Rules
Complex regular expression parsers are the most common source of pipeline slowdown. Audit your parsing rules periodically to identify regex patterns that cause backtracking or that attempt to parse unstructured logs into too many fields. Use delimiter-based parsing (CSV, key-value, or structured formats like JSON and XML) wherever possible, and reserve regex extraction only for truly unstructured data sources.
Consolidate parsing rules to reduce the number of sequential parsing stages. Each chained parsing step adds latency. Where a single parser can extract all required fields, it should—rather than passing an event through three separate parser transformations.
Event Routing and Filtering at Ingestion
Not every log event needs to enter the SIEM. Configure light-weight, pre-index filtering to discard events that are known to be non-actionable—debug-level logs, routine health checks, internal telemetry noise from monitored systems. For environments where regulation requires preservation of all logs, route deterministic log sources directly to archive storage without parsing or indexing them through the analytical pipeline.
Load Balancing and Pipeline Resource Sizing
For high-volume deployments, distribute ingestion across multiple parallel pipeline instances. Monitor pipeline queue depth and processing latency as leading indicators of capacity issues. A queue depth that consistently exceeds the maximum retention window of the ingestion buffer indicates that pipeline resources need to be scaled up or that filtering rules need to be tightened. In distributed SIEM architectures, ensure that heavy forwarders (on-premise collectors aggregating thousands of endpoints) are connected to dedicated pipeline nodes rather than competing with cloud-native data sources for the same processing capacity.
Scheduled Correlation and Alert Tuning
Real-time correlation consumes the most expensive processing resources because it evaluates every incoming event against detection logic. Scheduled correlations, by contrast, run at defined intervals over a time-bounded data set. Choosing the right execution model for each detection use case is a core performance tuning decision.
Real-Time Versus Scheduled Correlation
Reserve real-time correlation for high-fidelity, low-latency detection scenarios—known indicators of compromise, critical authentication failures, or direct threat intelligence matches. Move low-fidelity, high-volume detection logic—like anomaly baselining or statistical outlier detection—to scheduled correlations that run every 5, 10, or 30 minutes depending on the time sensitivity of the threat.
Alert Thresholds and Suppression
Every correlation rule should have a clearly defined threshold that suppresses noise without sacrificing detection coverage. For example, a rule that alerts on failed logins should have a minimum count threshold (e.g., 5 failures within 5 minutes) and a deduplication window to prevent alert storms from brute-force tools that generate thousands of events per second. Suppressing alerts at the correlation layer reduces downstream processing load on SOAR integration tiers and reduces dashboard query volumes.
Rule Lifecycle Management
Maintain an inventory of all correlation rules with metadata including rule owner, creation date, frequency, false positive rate, and last review date. Decommission rules that have not fired a true positive in the last six months. Refine rules that generate more than 20% false positives. This governance practice directly reduces scheduled query load and improves the signal-to-noise ratio of the entire detection program.
Storage Tier Optimization and Retention Architectures
Modern SIEM performance tuning extends beyond the query layer into the data storage infrastructure. A multi-tier storage architecture aligns data value with storage cost and access speed.
Hot, Warm, and Cold Data Tiering
Define explicit storage tiers based on data age and access frequency. Hot storage (SSD or high-performance object storage) holds the most recent 7–30 days of data, where the majority of detection and investigation queries operate. Warm storage (standard HDD or lower-cost object tiers) holds data from 30–90 days for compliance searches and trend analysis. Cold storage (archive tier or long-term retention systems) holds data beyond 90 days, queried only during incident response deep dives or audit requests. Route queries to the appropriate tier automatically through the SIEM's search head configuration rather than expecting analysts to specify storage tiers manually.
Rollover and Frozen Index Management
Configure index rollover policies that create new index buckets before existing buckets become too large. A single bucket containing hundreds of gigabytes of data creates indexing write contention and slower searches. Standard practice is to roll over indexes at the 40–60 GB mark or at a defined time interval (e.g., daily), whichever comes first. Implement automated frozen index management that moves data from warm to cold storage without manual intervention, based on retention policies aligned with Compliance Standards Automation requirements.
Continuous Performance Monitoring and Operational Cadence
SIEM performance tuning is not a one-time project—it is an ongoing operational practice embedded into the SOC's operational cadence.
Key Performance Indicators for SIEM Health
Track these KPIs on a weekly basis at minimum to detect degradation before it impacts operations:
- Average query execution time — broken down by data model, dashboard, and analyst role. Trending upward indicates index fragmentation, data model bloat, or resource saturation.
- Pipeline queue depth and processing latency — sustained queue growth above 30 seconds indicates ingestion pipeline capacity risk.
- Dashboard load time — measured at peak usage hours. Target under 5 seconds for operational dashboards, under 15 seconds for compliance reports.
- Index storage growth rate — compare against data source growth rate. Faster-than-expected growth suggests field extraction bloat or duplicate log sources.
- Correlation rule execution time — scheduled rules that consistently run to their timeout threshold need optimization or conversion to real-time processing.
Monthly Performance Review Cycle
Establish a monthly SIEM performance review that includes the SOC manager, a senior analyst, and the SIEM platform administrator. Review the KPIs above, identify the top three performance bottlenecks, and assign remediation actions. Common monthly actions include: retiring unused dashboards, consolidating correlation rules, tuning field extraction configurations, and adjusting index rollover policies based on observed data volume trends.
Quarterly Index and Data Model Audit
Every quarter, perform a comprehensive audit of index performance, data model usage, and field extraction coverage. Use the weaknesses of SIEM and how to overcome them framework to identify blind spots in your current tuning approach. Archive indexes that are no longer queried. Decommission data models that have zero scheduled queries or dashboard references. This quarterly discipline prevents the slow creep of performance degradation that most organizations experience.
Common Performance Tuning Mistakes
Awareness of common pitfalls helps teams avoid counterproductive tuning efforts that waste time and degrade performance further:
- Over-indexing every field — Indexing too many fields bloats storage and slows ingestion without proportional query benefit. Index only fields used in correlation rules or top-10 dashboards.
- Running all correlations in real time — Real-time processing is 5–10x more expensive than scheduled correlation. Use scheduled correlation for all non-critical detection logic.
- Creating dashboards for every stakeholder — Each dashboard adds query load. Disable dashboards that are viewed fewer than once per week, or consolidate multiple stakeholder views into a single dashboard with filter controls.
- Ignoring time zone normalization — Inconsistent time zone handling causes repeated conversion operations at query time. Normalize all timestamps to UTC at ingestion.
- Failing to document tuning decisions — Without documentation, each performance review restarts from zero. Maintain a tuning log that records changes, their measured impact, and the rationale behind them.
See How ThreatHawk SIEM Automates Performance Optimization
ThreatHawk SIEM includes built-in performance advisors that correlate query latency with index health, field usage, and pipeline load—giving your SOC actionable insights without requiring deep platform engineering expertise. Schedule a demo to see it in action.
Our Conclusion & Recommendation
SIEM performance tuning is a foundational SOC discipline that directly determines the speed and accuracy of threat detection, investigation, and compliance reporting. Organizations that treat performance tuning as a continuous operational practice—with weekly KPI monitoring, monthly review cycles, and quarterly deep audits—consistently achieve 60–80% faster query execution times and 20–35% lower storage costs compared to organizations that tune reactively.
For enterprise teams evaluating a new SIEM platform or optimizing an existing deployment, ThreatHawk SIEM offers a comprehensive performance tuning framework built into the platform itself—field usage analyzers, automated data model acceleration recommendations, intelligent query scheduling, and multi-tier storage management that aligns with SOC 2, ISO 27001, PCI DSS, HIPAA, NIST 800-53, and GDPR compliance frameworks. Automating the routine aspects of performance tuning frees your SOC analysts to focus on what matters: detecting and responding to threats before they become breaches.
Ready to Optimize Your SIEM Performance?
Get a free performance assessment and see how ThreatHawk can transform your SOC operations. Our team will analyze your current SIEM environment and deliver a customized optimization roadmap.