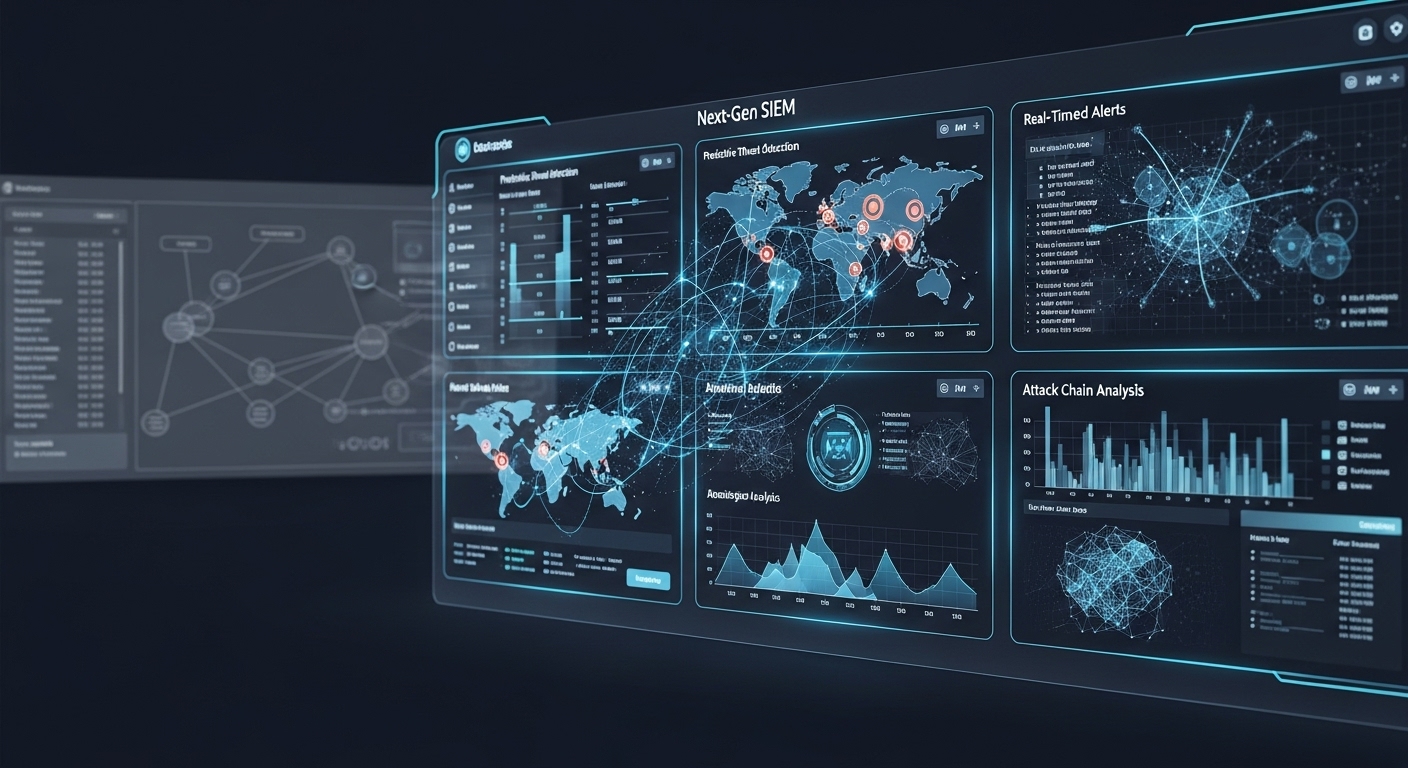
A typical SIEM dashboard presents a centralized real time view of security activity risk posture and operational performance across an organization. It aggregates security telemetry into visual panels that enable analysts engineers and executives to understand what is happening why it matters and what action is required. A SIEM dashboard is not a static reporting screen but a dynamic operational interface that supports detection investigation response and governance.
Purpose of a SIEM Dashboard
The primary purpose of a SIEM dashboard is to translate vast volumes of security data into clear actionable insight. Modern environments generate millions of events daily and without structured visualization critical threats remain hidden. A SIEM dashboard surfaces priority signals aligns them with risk and enables rapid decision making.
Different roles use the dashboard differently. Analysts monitor alerts and incidents. Engineers assess data quality and detection health. Leaders review trends and exposure. A well designed SIEM dashboard supports all these needs without overwhelming the user.
High Level Security Posture Overview
Most SIEM dashboards begin with an overview section that summarizes current security status. This section answers the immediate question of whether the organization is under active threat.
Active Alerts and Incidents
This component displays the number of active alerts and open incidents categorized by severity. It allows teams to quickly identify high risk situations that require immediate attention.
Risk and Severity Distribution
Severity charts show how alerts are distributed across critical high medium and low levels. This helps assess whether the environment is experiencing abnormal risk concentration.
A strong SIEM dashboard prioritizes clarity over volume ensuring the most important risks are visible at a glance.
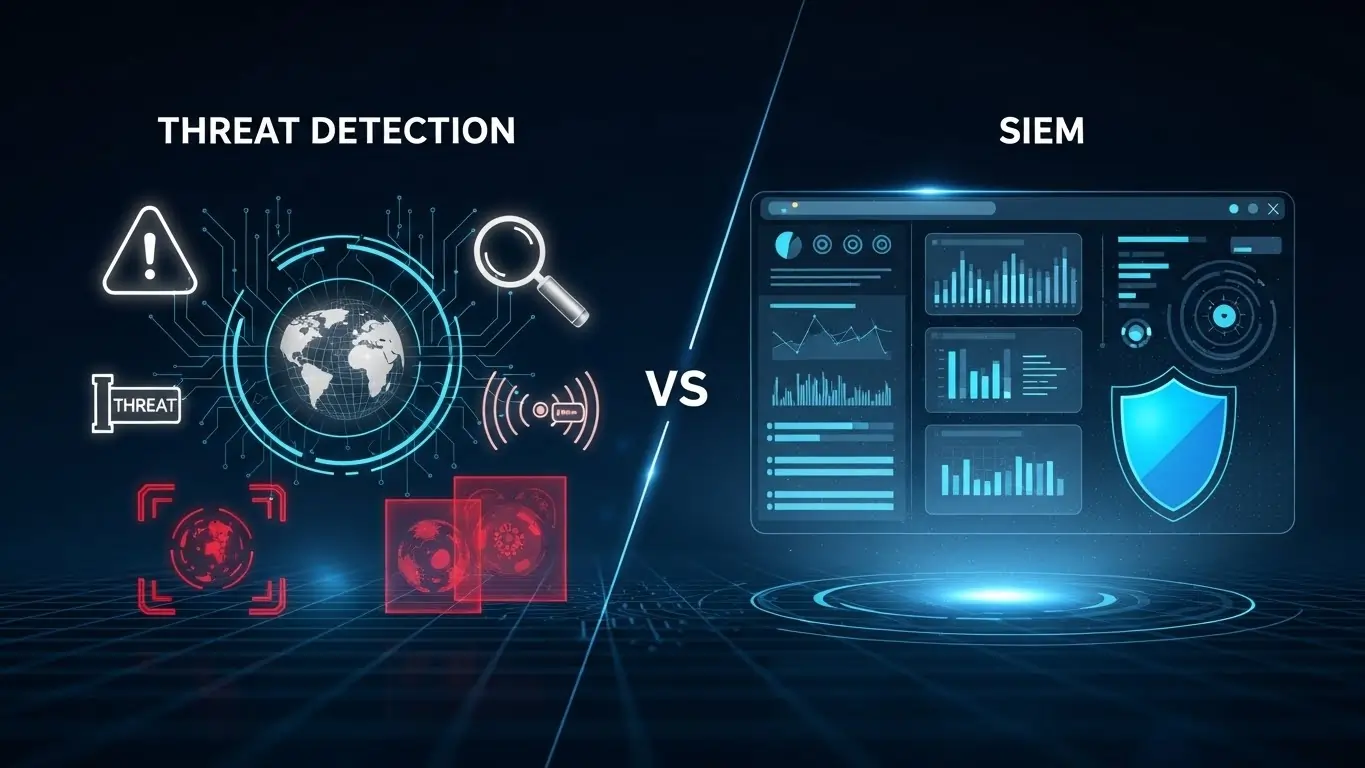
Threat Detection and Alert Panels
Threat detection panels are the operational core of a SIEM dashboard. They present detections generated from correlation rules behavioral analytics and anomaly models.
Top Triggered Detection Rules
This panel lists the detection rules firing most frequently within a defined time window. It helps analysts identify noisy detections or emerging attack patterns.
Recent High Risk Alerts
High risk alerts are highlighted with timestamps source context and affected assets. Quick access to these alerts accelerates triage and containment.
Incident Management View
SIEM dashboards commonly include an incident management section that groups related alerts into unified cases. This view provides context and progression rather than isolated signals.
Open Incidents by Status
Incidents are categorized by status such as new in progress or resolved. This allows teams to track workload and response efficiency.
Incident Timelines
Timeline views display how events unfolded during an incident showing attacker actions defensive responses and resolution steps.
Data Source and Log Ingestion Health
Effective detection depends on reliable data. SIEM dashboards therefore include visibility into log ingestion and source health.
Log Volume by Source
This panel shows event volumes per data source helping teams verify coverage and identify drops or spikes that may indicate issues or attacks.
Ingestion Errors and Latency
Monitoring ingestion errors and delays ensures logs arrive intact and timely. Missing data creates blind spots that attackers can exploit.
User and Identity Activity Panels
Identity is central to modern security. SIEM dashboards frequently include panels focused on authentication and access behavior.
Authentication Trends
Charts show login success and failure trends across time. Sudden changes can indicate brute force attempts or credential misuse.
Privileged Access Activity
Monitoring privileged account usage highlights risky behavior and potential insider threats.
Endpoint and Host Activity Visualization
Endpoint panels provide insight into system level behavior across servers and user devices.
Process and File Activity
These views highlight unusual process execution file changes or configuration modifications that may signal compromise.
Endpoint Alert Distribution
Alerts are broken down by endpoint group or operating system to identify localized issues.
Network and Traffic Monitoring Panels
Network visibility remains critical even in cloud centric environments. SIEM dashboards include panels confirming traffic patterns and security control actions.
Blocked and Allowed Connections
Firewall and network security logs are summarized to show trends in blocked and permitted traffic.
Suspicious Network Behavior
Panels may highlight scanning behavior unexpected external connections or unusual data transfer volumes.
Cloud and Infrastructure Activity
As organizations adopt cloud services SIEM dashboards extend to include infrastructure and control plane activity.
Resource Changes
Dashboards show creation modification and deletion of cloud resources enabling detection of unauthorized changes.
Cloud Identity Actions
Visibility into cloud role assignments and access decisions helps detect privilege escalation.
Compliance and Audit Panels
Many SIEM dashboards include compliance focused views that translate technical activity into governance insight.
Control Coverage Status
This panel shows which compliance controls are actively monitored and which may have gaps.
Policy Violation Tracking
Policy related alerts are summarized to support regulatory reporting and internal review.
Operational Metrics and Performance Indicators
Beyond detection SIEM dashboards track operational effectiveness of the security program.
Mean Time Metrics
Metrics such as time to detect and time to respond indicate how efficiently the team handles threats.
Alert Volume Trends
Trends over time help leaders understand whether security posture is improving or degrading.
Role Based Dashboard Customization
A typical SIEM platform allows dashboards to be tailored by role. Analysts engineers and executives require different levels of detail.
Analyst Focused Views
Analyst dashboards emphasize alerts incidents and investigation tools.
Executive Summary Views
Executive dashboards focus on risk trends exposure and compliance status rather than raw events.
Step by Step How a SIEM Dashboard Is Used
Monitor current security status
The dashboard provides a real time snapshot of alerts incidents and risk levels.
Identify priority threats
High severity detections are quickly identified for investigation.
Investigate using contextual panels
Analysts pivot from alerts to related user endpoint and network activity.
Track response and resolution
Incident status and timelines support coordinated response.
Review trends and improve posture
Historical panels inform tuning and strategic decisions.
Example Components of a SIEM Dashboard
What Makes a SIEM Dashboard Effective
An effective SIEM dashboard balances depth and simplicity. It surfaces critical information without forcing users to search through noise. Consistent layout intuitive navigation and meaningful metrics are essential.
Dashboards must evolve as threats and environments change. Static dashboards quickly lose relevance in dynamic organizations.
Limitations of Poorly Designed Dashboards
Overloaded dashboards create alert fatigue and confusion. Excessive widgets redundant metrics and unclear prioritization reduce effectiveness.
A dashboard should guide action not simply display data.
SIEM Dashboards in Advanced Platforms
Enterprise platforms enhance dashboards with automation drill down workflows and integrated response actions. Solutions such as Threat Hawk SIEM focus on turning dashboards into operational command centers rather than passive displays.
Industry Perspective on SIEM Dashboard Design
Different SIEM tools vary widely in dashboard capabilities. Comparative insight into leading platforms can be found in top 10 SIEM tools which evaluates visualization analytics and usability.
How CyberSilo Helps Organizations Optimize SIEM Dashboards
CyberSilo helps organizations design dashboards aligned to risk business objectives and operational maturity. This includes defining metrics selecting visualizations and ensuring dashboards drive response.
Organizations can contact our security team to assess current dashboards and improve their effectiveness.
Conclusion
A typical SIEM dashboard includes security posture summaries threat detection panels incident management views data health indicators and compliance metrics. Together these components transform raw security data into clear actionable insight. When designed and used effectively a SIEM dashboard becomes the central interface through which organizations monitor defend and continuously improve their security posture.